 The Office Concept
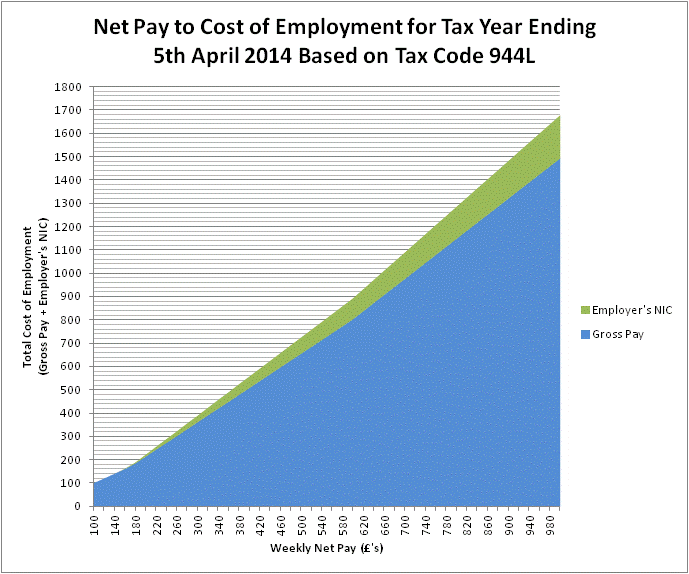
| Weekly | Monthly | Annual | |||||||
|---|---|---|---|---|---|---|---|---|---|
| Net Pay | Gross Pay | Employer's NI | Total Cost | Net Pay | Gross Pay | Employer's NI | Total Cost | Salary | Total Cost |
100 |
100 |
0 |
100 |
433 |
433 |
0 |
433 |
5,200 |
5,200 |
110 |
110 |
0 |
110 |
477 |
477 |
0 |
477 |
5,720 |
5,720 |
120 |
120 |
0 |
120 |
520 |
520 |
0 |
520 |
6,240 |
6,240 |
130 |
130 |
0 |
130 |
563 |
563 |
0 |
563 |
6,760 |
6,760 |
140 |
140 |
0 |
140 |
607 |
607 |
0 |
607 |
7,280 |
7,280 |
150 |
150 |
0 |
150 |
650 |
650 |
2 |
652 |
7,809 |
7,828 |
160 |
161 |
2 |
163 |
693 |
700 |
8 |
708 |
8,398 |
8,495 |
170 |
173 |
3 |
176 |
737 |
749 |
15 |
764 |
8,987 |
9,162 |
180 |
185 |
5 |
190 |
780 |
801 |
22 |
823 |
9,613 |
9,875 |
190 |
199 |
7 |
207 |
823 |
864 |
31 |
895 |
10,372 |
10.742 |
200 |
214 |
9 |
223 |
867 |
928 |
40 |
968 |
11,142 |
11,619 |
220 |
244 |
13 |
257 |
953 |
1,055 |
57 |
1,112 |
12,664 |
13,349 |
240 |
273 |
17 |
290 |
1,040 |
1,184 |
75 |
1,259 |
14,203 |
15,104 |
250 |
288 |
19 |
307 |
1,083 |
1,247 |
83 |
1,331 |
14,967 |
15,968 |
260 |
302 |
21 |
323 |
1,127 |
1,310 |
92 |
1,403 |
15,726 |
16,834 |
280 |
332 |
25 |
357 |
1,213 |
1,438 |
110 |
1,548 |
17,259 |
18,575 |
300 |
361 |
29 |
391 |
1,300 |
1,566 |
128 |
1,693 |
18,788 |
20,320 |
320 |
391 |
33 |
424 |
1,387 |
1,692 |
145 |
1,838 |
20,310 |
22,051 |
340 |
420 |
38 |
458 |
1,473 |
1,821 |
163 |
1,984 |
21,849 |
23,805 |
350 |
435 |
40 |
474 |
1,517 |
1,884 |
171 |
2,056 |
22,613 |
24,669 |
360 |
449 |
42 |
491 |
1,560 |
1,948 |
180 |
2,128 |
23,372 |
25,536 |
380 |
479 |
46 |
525 |
1,647 |
2,075 |
198 |
2,274 |
24,911 |
27,290 |
400 |
508 |
50 |
558 |
1,733 |
2,202 |
216 |
2,418 |
26,434 |
29,021 |
425 |
545 |
55 |
600 |
1,842 |
2,362 |
238 |
2,600 |
28,349 |
31,202 |
450 |
582 |
60 |
642 |
1,950 |
2,522 |
259 |
2,781 |
30,259 |
33,369 |
475 |
619 |
65 |
683 |
2,058 |
2,680 |
281 |
2,961 |
32,164 |
35,540 |
500 |
655 |
70 |
725 |
2,167 |
2,840 |
304 |
3,143 |
34,080 |
37,722 |
525 |
692 |
75 |
767 |
2,275 |
3,000 |
326 |
3,325 |
35,995 |
39,903 |
550 |
729 |
80 |
809 |
2,383 |
3,159 |
348 |
3,507 |
37,911 |
42,084 |
575 |
766 |
85 |
851 |
2,492 |
3,318 |
369 |
3,687 |
39,810 |
44,241 |
600 |
803 |
90 |
893 |
2,600 |
3,480 |
392 |
3,872 |
41,764 |
46,465 |
625 |
846 |
96 |
942 |
2,708 |
3,667 |
417 |
4,084 |
44,003 |
49,013 |
650 |
889 |
102 |
992 |
2,817 |
3,854 |
443 |
4,297 |
46,243 |
51,561 |
675 |
932 |
108 |
1,041 |
2,925 |
4,040 |
475 |
4,509 |
48,482 |
54,108 |
700 |
975 |
114 |
1,090 |
3,033 |
4,227 |
495 |
4,721 |
50,721 |
56,656 |
800 |
1,148 |
138 |
1,286 |
3,467 |
4,975 |
598 |
5,573 |
59,699 |
66,876 |
900 |
1,320 |
162 |
1,482 |
3,900 |
5,721 |
701 |
6,422 |
68,656 |
77,066 |
1,000 |
1,493 |
185 |
1,678 |
4,333 |
6,468 |
804 |
7,271 |
77,612 |
87,257 |
 The Office Concept is a member of The Federation of Small Businesses.